Landscapers Outlook for Equipment Purchases 2017 vs. 2016
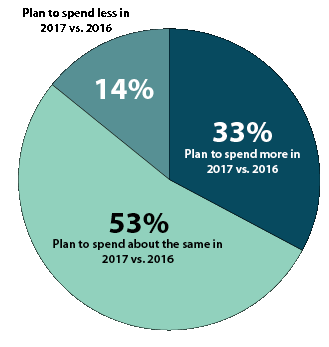
According to a survey of U.S. landscapers by Seaport Global Securities, 33% plan to spend more on equipment in 2017 than they did last year, while 14% plan to spend less.
Source: U.S. Bureau of Labor Statistics
Landscape contractors, one of the prime market segments for rural lifestyle equipment dealers, continue to show strong growth potential in 2017.
According to the results of an exclusive survey by investment bank Seaport Global Securities, more than 80% of U.S. landscapers they surveyed are forecasting revenue growth in 2017.
Summarizing the survey results, Michael Shlisky, machinery analyst at Seaport Global who conducted the survey and analyzed the results, said, “39% of landscape contractors expect to see revenue growth of 10% or more in 2017, up from 33% in the SGS December survey.
“About 31% expect to see revenue growth of 5-10% this year, relatively unchanged from the last survey, while 14% expect growth of 2%-5%, which is down from 18% 3 months ago. Roughly the same percentage of respondents, about 18%, expect a flat or down year vs. 3 months ago.”
Shlisky adds, “Landscapers continue to expect to spend more on equipment in 2017 vs. 2016.”
Employment in landscaping services has also showed solid growth during the past 3 years.
After peaking at 681,000 in 2007, the housing bubble took its toll on landscape employees. By 2010, the number of employees dropped by nearly 10% to 616,000. Since that time, employment levels have shown consistent growth, reaching 756,000 landscape employees by 2016.
Shlisky also noted that sentiment in the sector also improved slightly since the previous survey in December 2016, with 44% of respondents “feeling better about their business than 3 months ago.”
OPE Dealers’ Head Count Stable Through Ups & Downs
| Head Count* | 2012 | 2013 | 2014 | 2015 | 2016 | 2012 vs. 2016 +/- |
| Sales manager | 0.44 | 0.67 | 0.61 | 0.70 | 0.49 | +0.05 |
| Sales person | 1.05 | 1.04 | 1.12 | 1.01 | 1.08 | +0.03 |
| Parts manager | 0.63 | 0.72 | 0.65 | 0.79 | 0.66 | +0.03 |
| Parts counter sales | 1.31 | 0.96 | 1.35 | 1.04 | 1.18 | –0.13 |
| Service manager | 0.67 | 0.83 | 0.79 | 0.76 | 0.69 | +0.02 |
| Service technicians | 2.88 | 2.67 | 3.07 | 2.81 | 2.77 | –0.11 |
| Total Average | 11.53 | 10.31 | 11.50 | 11.16 | 10.59 | –0.94 |
| Total Revenue (millions) | $3.32 | $2.87 | $2.85 | $3.33 | $4.34 | 31% |
| *Does not include all titles or dealership positions Source: United Equipment Dealers Assn. |
High Low | |||||


Post a comment
Report Abusive Comment