Survival rate is defined as the share of Census respondents with positive sales in 2007 who also reported positive sales in the 2012 Census. DTC status and sales size class are determined by sales in 2007. Source: USDA Economic Research Service Census of Agriculture 2007 & 2012
Source: USDA Economic Research Service Census of Agriculture 2007 & 2012
From the editors of Ag Equipment Intelligence
As the market for local foods continues to expand, the customer base for many rural lifestyle dealers includes direct-to-consumer (DTC) farms. Comparing data from USDA’s 2007 and 2012 (most recent data) Census of Agriculture show DTC farm operations with DTC sales of food increased from 116,733 to 144,530. At the same time, the number of farmers’ markets grew to 8,268 in 2014, up 180% from 2006.
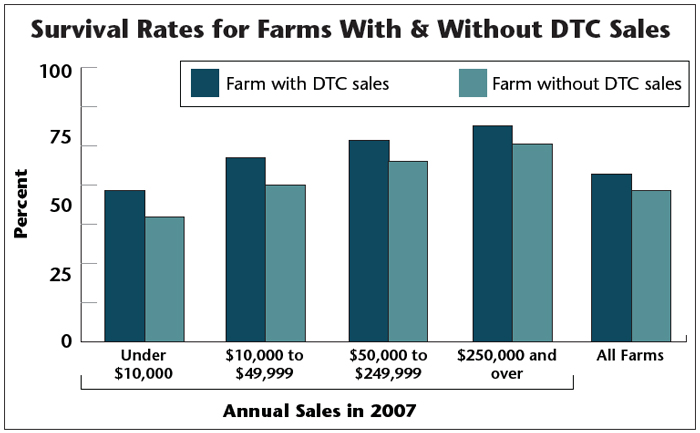
Even more revealing is the survival rate of DTC farming operations vs. farms that utilize traditional channels. According to Census data, 55.7% of farms that market through traditional channels, such as grain distributors, processors and wholesalers, that were in business in 2007 made it to 2012 with the same operator. This compares to 61% of DTC operations, where producers engage with consumers face-to-face at roadside stands, farmers’ markets, pick-your-own farms, on-farm stores, and community-supported agricultural arrangements (CSAs).
Based on a comparison of farms across four size categories (defined by annual sales), farmers with DTC sales had a higher survival rate (measured as the share of farmers who reported positive sales in 2007 and 2012) in each category. The differences in survival rates were substantial — ranging from 10 percentage points for the smallest farms to about 6 percentage points for the largest.


Post a comment
Report Abusive Comment