From the Feb. 15 issue of Ag Equipment Intelligence:
Is organic farming a viable market to pursue for farm equipment dealers and manufacturers?
If nothing else, it’s one of the few ag segments that has demonstrated solid, ongoing growth during the past decade. USDA’s National Agricultural Statistics Survey (NASS) recently released the results of its 2015 Certified Organic Survey (latest data available) that showed a 13% increase in organic production from $5.5 billion in 2013 to $6.2 billion in 2015.
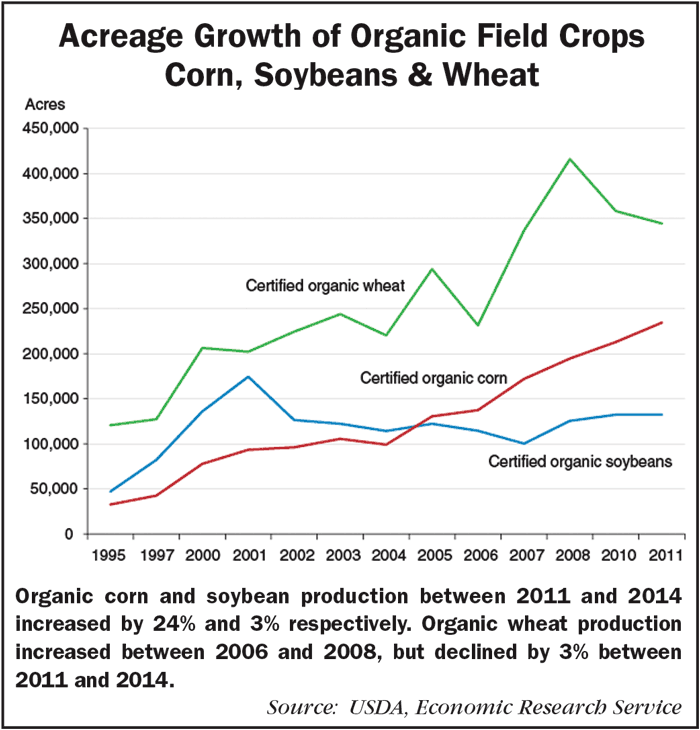
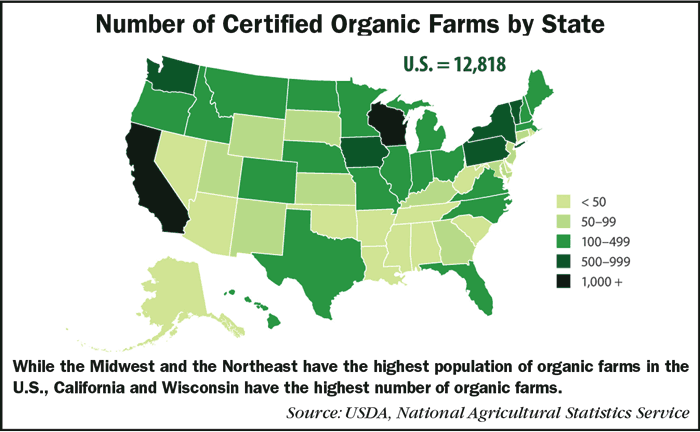
The demand for organic products has been increasing by double-digits since the 1990s. Organic crop acreage also grew from 1.3 million to 3.1 million between 2002 and 2011. More than 12,800 certified organic farms in the U.S. produce 4% of U.S. food sales.
Price or Yields?
NASS survey data also illustrates the high profitability from adopting organic crop production. While conventional farming still produces higher yields than organic farming, the high price of organic products offsets the lower yields and higher production costs. According to NASS, organic corn prices were $5-$10 higher than conventional corn from 2011-2015 with the economic cost difference being only $1.92-$2.27 higher. Similarly, organic soybeans were $10-$15 dollars higher with a $6.62-$7.81 higher economic cost difference.
Crop Costs
Survey data also points to lower operating costs and operating plus capital costs per acre for organic crop production compared to conventional production. The operating cost for organic corn was $80 less and operating plus capital costs was $50 less than conventional production. Conventional crop production had higher costs for seed, fertilizer and chemicals, but lower costs for fuel, repairs, capital and labor.
These economic benefits of organic crop production resulted in increases of organic corn and soybean production between 2011 and 2014 with a 24% increase and 3% increase respectively. Organic wheat production, though drastically increasing between 2006 and 2008, has since dropped by 3% between 2011 and 2014.
Product Sectors
Of the $6.2 billion in organic commodities sold, $3.5 billion, or 57%, came from organic crops, $1.9 billion (31%) from organic livestock and poultry products (primarily milk and eggs), and $0.7 billion (12%) from organic livestock and poultry (primarily broiler chickens).
Milk and eggs were the top two commodities sold, valued at $1.2 billion and $0.7 billion, respectively, followed by broiler chickens valued at $0.4 billion. Two sectors — vegetables grown in the open and fruits, tree nuts and berries — together accounted for 42% of sales. Among crops, apples, lettuce and grapes were the top selling commodities, with $302 million, $262 million and $210 million in 2015 sales, respectively.
States & Sales
Nationally 71% of certified organic farms sold to wholesale markets, 36% sold directly to consumers and 22% sold directly to retail markets and institutions. Some farms use one or two of these sales options, while others utilize all three. Of the total, 75% of the first point of sale was within 100 miles of the farm. Now organic products are found in about 3 of every 4 conventional grocery stores.
States varied in how organic producers market and sell their goods. The percent of farms selling directly to consumers was highest in southeastern and northeastern states, and lowest in central states. In New England, the majority of certified farms sold at least part of their production directly to consumers, while in Nebraska and North Dakota, 10% or less did so.
In NASS’s 2015 survey, California and Wisconsin were the two states with the greatest number of organic farms at 2,637 and 1,205 respectively. The Midwest and the Northeast regions have the highest population of organic farms in the U.S.