Many economic indicators that measure the general health of the U.S. economy are trending upward, and this is good news for rural lifestyle dealers who count on sales of smaller equipment and machinery. This is particularly true when compared to dealerships who rely on big ag equipment for a bulk of their sales. Unit sales of tractors bear this out during the past decade.
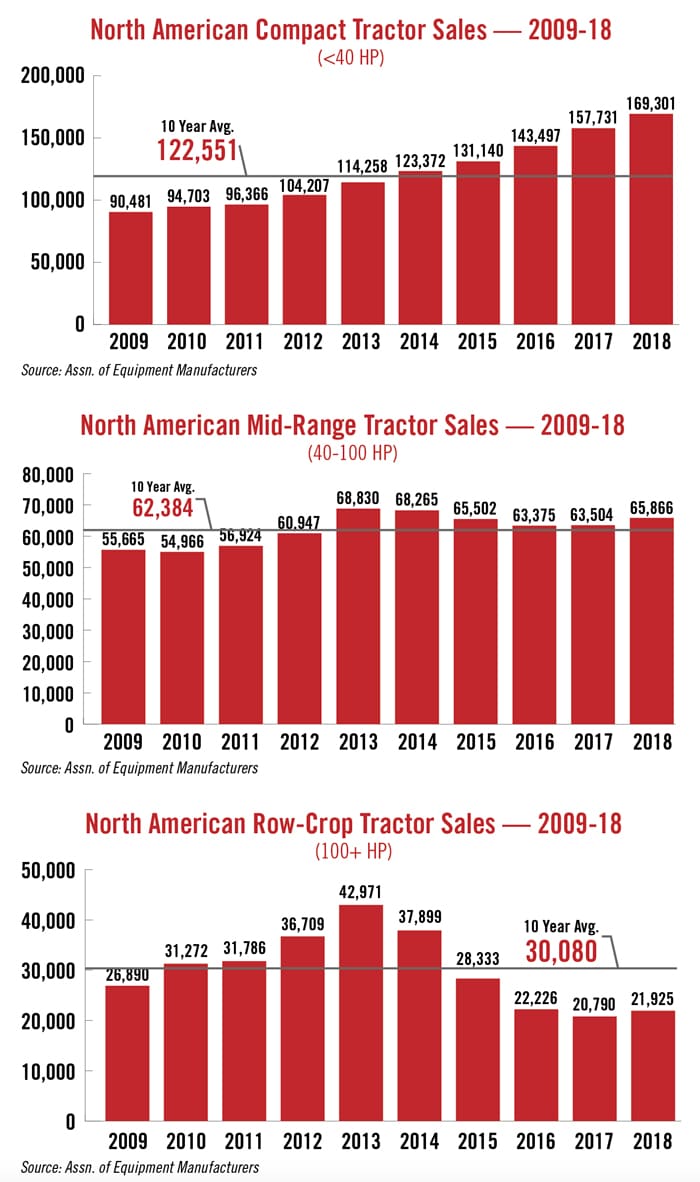
From the beginning of the last 10-year period through 2018, sales of compact tractors (under 40 horsepower) are up by 87% and they are higher than the average during this same period by 38%.
For the same period of 2009-18, mid-range (40-100 horsepower) tractors, while down by a little over 4% from the peak year (2013) are up by 18%. Sales in 2018 are also up 5.6% when compared to the 10-year sales average.
Meanwhile, high horsepower (100-plus) row-crop tractor sales continue struggling to get somewhere near the average over the past decade. Compared to the sales during the peak year of 2013, unit sales in 2018 were nearly 50% lower. Compared to 10 years earlier, 2018 sales of high horsepower equipment are nearly 19% lower. When matched up against the 10-year average, row-crop tractor sales are down by 27%.
Comparing Indicators
Because the sale of small and mid-size tractors are more closely tied with the general economy, the typical indicators include sales of new single family homes and disposable personal income. For the last 10 years where complete data is available (2008-17), new home sales have risen by nearly 8% and disposable income is up by about 8.5%. Most recently, the U.S. Department of Commerce reported that sales of new single family homes has continued on a strong upward path as March 2018 unit sales were up by about 6% vs. a year earlier.
Wall Street Journal reported on April 1 the “The U.S. spring home buying season is shaping up as the best in years … About 40% of the year’s sales take place from March through June.”
In addition, spending on non-auto durables, another economic indicator that can be tied to the health of the general economy, is up by nearly 6%. Another trend that is an important sign of the general condition of the rural lifestyle market for dealers is landscaping employment. Jobs in this sector are up 8.5% vs. 10 years earlier and up nearly 4% year-over-year.
The most important indicators for the production ag segment include net farm income and commodity prices. USDA’s Economic Research Service recently updated its farm profitability projections for 2019 and it is forecasting that net farm income, a broad measure of profits, is forecast to increase $6.3 billion (10%) from 2018 to $69.4 billion in 2019, after decreasing $12 billion (16%) in 2018. In its report, the agency said, “If realized, inflation-adjusted net farm income and net cash farm income would remain well below their historical averages ($90 billion and $108 billion) across 2000-17.”
With a huge surplus in most of the major crops, prices are not expected to move much higher in the near term. For the same period, 2008-17, 2017 per-bushel corn prices are down 50% from their 2012 peak and down 3.5% year-over-year. Soybeans prices have declined 33% since they peaked in 2013 and are about even year-over-year in 2017. Milk prices in 2017, on the other hand, were up nearly 9% year-over-year, but down 26% since they peaked in 2014.
All in all, dealers who specialize in smaller farm equipment have a lot of momentum moving in the right direction and need to be prepared to take full advantage of current positive conditions.