Have you checked out the USDA Ag Census Web Maps application to uncover data and trends in your dealership's region? The Maps application assembles maps and statistics from the 2012 Census of Agriculture in five broad categories:
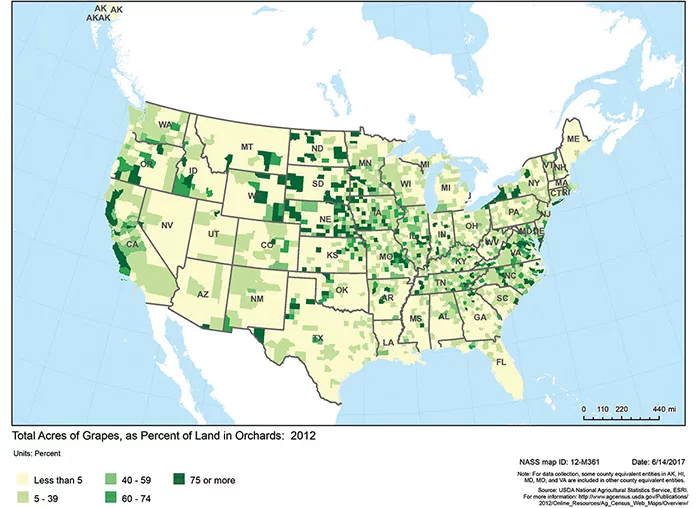
- Crops and plants – Data on harvested acreage for major field crops, hay, and other forage crops, as well as acreage data for vegetables, fruits, tree nuts, and berries.
- Economics – Data on agriculture sales, farm income, government payments from conservation and farm programs, amounts received from loans, a broad range of production expenses, and value of buildings and equipment.
- Farms – Information on farm size, ownership, and Internet access, as well as data on total land in farms, land use, irrigation, fertilized cropland, and enrollment in crop insurance programs.
- Livestock and animals – Statistics on cattle and calves, cows and heifers, milk cows, and other cattle, as well as hogs, sheep, goats, horses, and broilers.
- Operators – Statistics on hired farm labor, tenure, land rented or leased, primary occupation of farm operator, and demographic characteristics such as age, sex, race/ethnicity, and residence location.
What Can You Do with the Web Maps?
The Ag Census Web Maps application allows you to:
- Select a map to display from a list of five general categories and associated subcategories.
- Zoom and pan to a specific area; use the inset buttons to center the map on the continental U.S.; zoom to a specific state; and show the state mask to fade areas surrounding the state.
- Create and print maps showing the variation in a single data item across the U.S. (for example, average value of agricultural products sold per farm).
- Select a county and view and download the county’s data for a general category.
- Download the U.S. county-level dataset of mapped values for all categories in Microsoft Excel format.
Try out the application to learn about new or growing segments.